AI TOOLS
AddGraph
AddGraph
Description
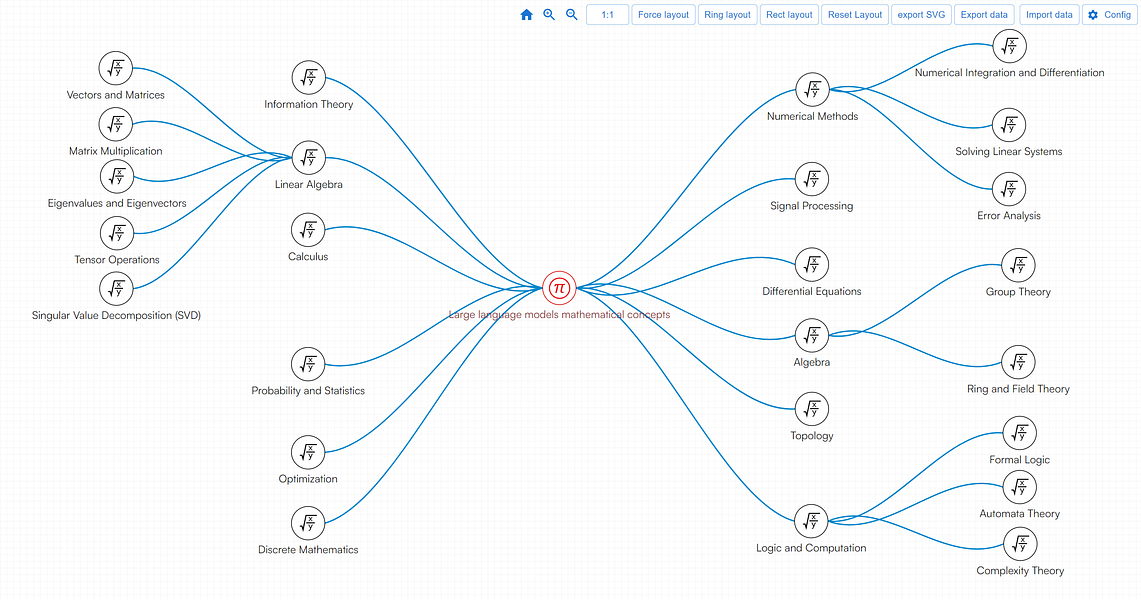
AddGraph is a streamlined flowchart drawing tool designed for speed and simplicity. It allows for rapid addition of nodes and lines, with customizable features including resizable nodes, and adjustable icon, border, and title colors. Users can choose from various line styles—straight, dashed, or broken—and modify their color and width. Titles and arrows can also be added to lines. Additionally, AddGraph serves as a data visualization tool, offering three layout methods: force layout, circular layout, and rectangular layout. This combination of features makes AddGraph an efficient and versatile tool for creating and visualizing flowcharts.
How we innovate
AddGraph is a streamlined flowchart drawing tool designed for speed and simplicity. It allows for rapid addition of nodes and lines, with customizable features including resizable nodes, and adjustable icon, border, and title colors. Users can choose from various line styles—straight, dashed, or broken—and modify their color and width. Titles and arrows can also be added to lines. Additionally, AddGraph serves as a data visualization tool, offering three layout methods: force layout, circular layout, and rectangular layout. This combination of features makes AddGraph an efficient and versatile tool for creating and visualizing flowcharts.
Use Case / Scenario
- Rapid Flowchart Creation: Quickly add nodes and lines to build flowcharts efficiently, saving time in diagram creation.
- Customizable Nodes: Resize nodes and adjust colors for icons, borders, and titles to match your design preferences.
- Varied Line Styles: Choose from straight, dashed, or broken lines, and customize their color and width for enhanced diagram clarity.
- Title and Arrow Integration: Add titles and arrows to lines for better labeling and direction in your flowcharts.
- Three Layout Methods: Utilize force layout, circular layout, and rectangular layout to organize your flowcharts effectively.
- Efficient Data Visualization: Visualize data clearly and concisely with AddGraph’s versatile flowcharting capabilities.
- User-Friendly Interface: Benefit from a straightforward and intuitive interface that simplifies the flowchart creation process.
- Enhanced Customization: Personalize your diagrams with extensive customization options for a professional finish.
- Versatile Tool: Use AddGraph for a variety of applications, from business process mapping to project management and more.
- Streamlined Workflow: Improve your workflow by creating and visualizing flowcharts quickly and easily with AddGraph’s streamlined features.
Copyright © 2024 AI SCOUT. All rights reserved.
Designed by Softversum