AI TOOLS
ChartGen AI
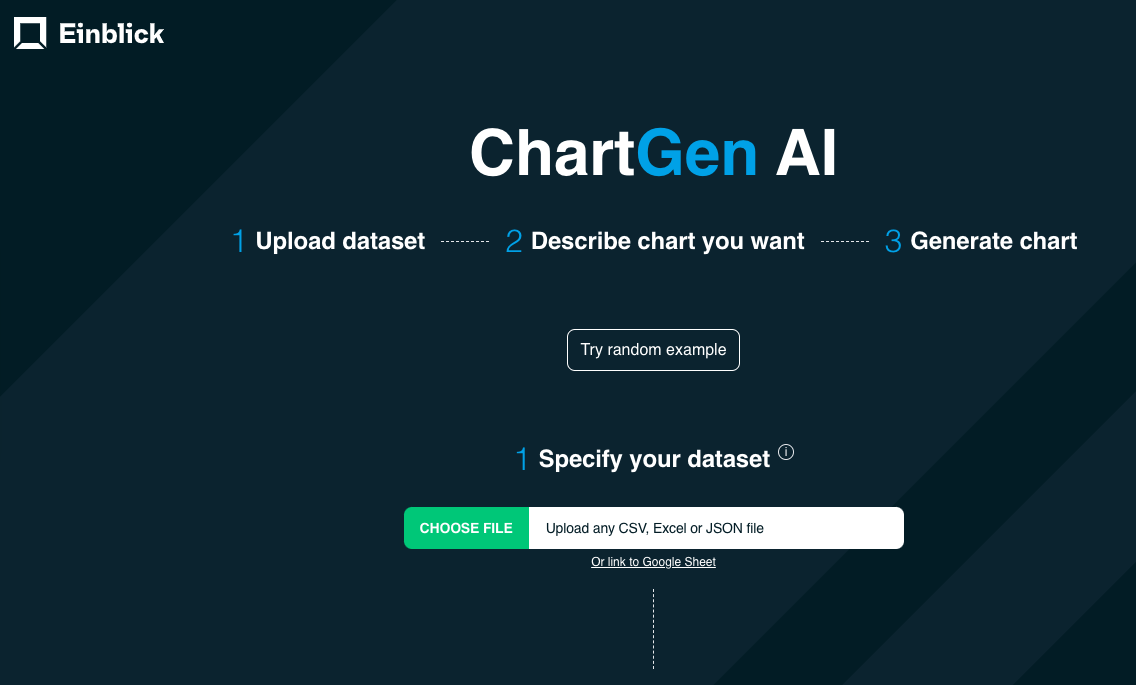
ChartGen AI
Description
ChartGen AI is a user-friendly tool that simplifies data visualization in three easy steps. First, upload your dataset in CSV, Excel, JSON, or link a Google Sheet. Next, describe the chart you want to create. Finally, ChartGen AI generates the perfect chart based on your data and description. This tool makes data visualization accessible, even for those without extensive data analysis skills. It's a valuable resource for anyone looking to visualize data quickly and effectively. Perfect for professionals, educators, and students seeking streamlined data insights.
How we innovate
ChartGen AI simplifies data visualization by automating chart creation from various data formats based on user descriptions, making it accessible to non-experts.
Use Case / Scenario
Professional Data Analysis
- Description: Professionals can quickly generate insightful charts from their data, enabling them to present clear and compelling visualizations in meetings, reports, or presentations.
- Benefits: Saves time, enhances data-driven decision-making, and improves communication of complex data.
Educational Purposes
- Description: Educators can use ChartGen AI to create engaging and informative charts to aid in teaching complex concepts.
- Benefits: Makes learning more interactive, helps students grasp difficult topics through visual representation, and allows educators to focus on teaching rather than chart creation.
Student Projects and Assignments
- Description: Students can effortlessly visualize their data for projects, assignments, or research papers, regardless of their data analysis skills.
- Benefits: Facilitates better understanding of data, improves the quality of presentations, and helps in achieving better grades by showcasing data effectively.
Business Reporting
- Description: Businesses can use ChartGen AI to generate charts for internal and external reports, helping to present sales figures, market analysis, and other critical data clearly.
- Benefits: Enhances the clarity of business reports, aids in strategic planning, and improves stakeholder communication.
Marketing and Sales Analysis
- Description: Marketing and sales teams can visualize campaign performance, customer data, and sales trends to optimize strategies.
- Benefits: Provides quick insights into marketing and sales data, supports data-driven marketing decisions, and helps in identifying growth opportunities.
Research and Development
- Description: Researchers can use ChartGen AI to visualize experimental data, survey results, and other research findings.
- Benefits: Simplifies the presentation of research data, aids in analysis and interpretation, and enhances the impact of research publications and presentations.
Public Policy and Administration
- Description: Policy makers and administrators can create clear visual representations of demographic data, economic indicators, and other statistics to support policy decisions.
- Benefits: Improves the accessibility and understanding of complex data, aids in transparent policy making, and enhances public communication.
Health and Medical Data Visualization
- Description: Healthcare professionals can visualize patient data, treatment outcomes, and public health statistics to support medical research and patient care.
- Benefits: Enhances the analysis of health data, supports evidence-based medical decisions, and improves patient education and communication.
Copyright © 2024 AI SCOUT. All rights reserved.
Designed by Softversum